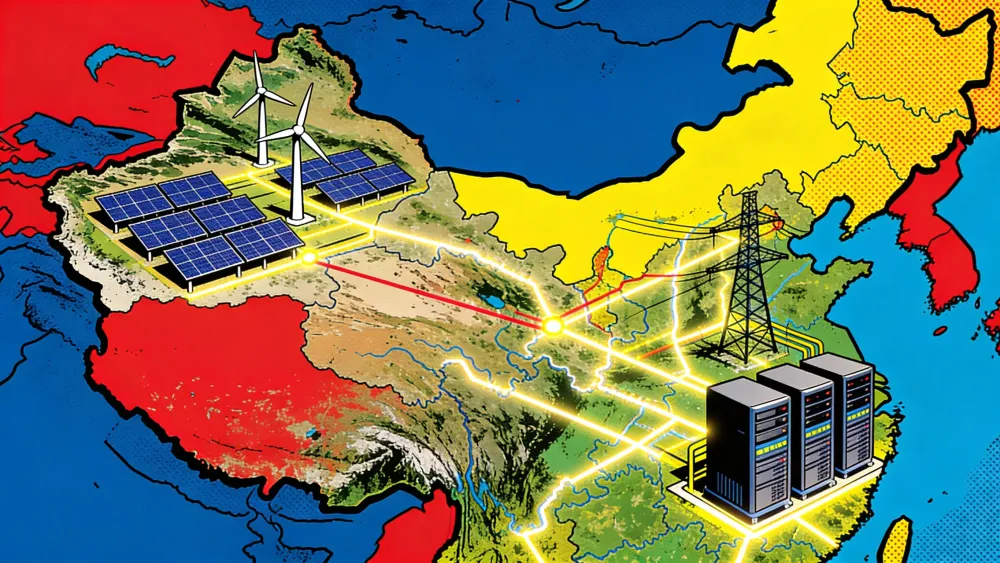
Nature published a study this week by researchers from Peking University and Alibaba Group’s DAMO Academy that uses satellite imagery to inventory China’s solar and wind assets. The paper says the team identified 319,972 solar photovoltaic facilities and 91,609 wind turbines in 2022. Xinhua reported that the model covered 1,915 Chinese counties after processing more than 7.56 TB of high-resolution satellite imagery, and quoted Liu Yu, a Peking University professor and corresponding author, describing the dataset as a “Bird’s eye view” of the country’s renewable energy landscape.
The study tests four coordination strategies for using those assets. In one modeled case, nationwide inter-provincial coordination in an 80% dispatchable-flexibility system raises effective renewable penetration by 99.88 TWh, according to the paper. That is equal to 9.1% of the solar and wind generation in the study, or about 120 hours of national average load. Xinhua described the increase as usable clean energy that would otherwise be curtailed, without requiring additional generation capacity.
Key Takeaways
- Nature mapped 319,972 solar facilities and 91,609 wind turbines in China’s 2022 renewable asset base.
- Nationwide coordination could raise effective renewable penetration by 99.88 TWh in an 80% dispatchable-flexibility system.
- Curtailment is rising as AI data-center demand pushes more load toward renewable-rich western hubs.
- The hard part is no longer only capacity. It is absorption across provincial grid boundaries.
AI-generated summary, reviewed by an editor. More on our AI guidelines.
Curtailment sets the background
Reuters reported in August 2025 that China’s renewable buildout was running ahead of the grid’s ability to absorb all of the output. Official data cited by Reuters showed higher solar and wind curtailment than a year earlier, after China relaxed its national benchmark in 2024.
The provincial figures were sharper. Tibet was the outlier Reuters named: 30.2% wind curtailment and 33.9% solar curtailment in the first half, after 2.3% and 5.1% a year earlier. Qinghai’s solar curtailment reached 15.2%, up from 8.8%. Shanghai, Chongqing and Fujian reported no curtailment, Reuters said.
“China will still push for decarbonization, but not necessarily on renewable installation,” Natixis economist Haoxin Mu told Reuters. “China might switch its policy focus or target focus from installation volume” to utilization.
The inventory changes the planning unit
The Nature paper starts from observed deployment rather than hypothetical assets. The authors say the inventory was built with sub-metre satellite imagery and a deep-learning framework. The code for the complementarity analysis was released separately, while high-resolution geospatial data was withheld because it describes critical energy infrastructure. During manual verification, the extended-data note says, Jilin-1 satellite imagery helped check regions where Google imagery inference missed installations.
The dispatch logic is straightforward. The hourly pattern is the reason: solar output rises during daylight, and wind often strengthens after dark. The paper’s contribution is to test how that offset changes when the pairing moves beyond local or neighboring regions. The authors report that complementarity improves as the geographic scope expands, with nationwide inter-provincial coordination outperforming narrower strategies in the modeled system.
AI infrastructure now runs through the grid
Strategic AI news from San Francisco. No hype, no "AI will change everything" throat clearing. Just what moved, who won, and why it matters. Daily at 6am PST.
No spam. Unsubscribe anytime.
Data centers move toward the resource base
Rystad Energy expects China’s data-center capacity to rise from 32 GW at the end of 2025 to more than 60 GW by 2030. Its 2030 power-demand forecast for the sector is 289 TWh, about 2.3% of national electricity demand. AI and high-performance-computing facilities rise from 39% of installed capacity in 2026 to 48% by 2030 in Rystad’s forecast.
“China’s data center sector is no longer a peripheral part of the country’s power system,” Simeng Deng, Rystad’s senior analyst for renewables and power research, wrote in April. “It is becoming a structural driver of demand in its own right.”
Some new AI and data-center capacity is already being steered toward western computing hubs. Rystad cites Zhongjin’s Ulanqab base, connected to 200 MW of wind, 100 MW of solar and 45 MW / 180 MWh of battery storage. China Mobile’s Qaidam Green microgrid has 122 MW-peak of rooftop solar and 75 MW / 300 MWh of storage. Carbon Brief says many data centers still sit in eastern China, where the IEA puts coal at about 70% of data-center electricity supply.
Absorption is now the test
Dialogue Earth reported that China’s coal-fired power generation and power-sector CO2 emissions fell in 2025 for the first time in a decade, but 18 provinces cut emissions while 13 increased them. Inner Mongolia and Shandong reduced fossil generation by about 42 TWh together, more than the national net decline, Lauri Myllyvirta and Qin Qi wrote.
The same analysis estimates that wind and solar generation would have been 13% higher if severe curtailment and utilization losses had been avoided, enough to displace a further 5% of coal-fired generation. The lost generation was worth about US$17 billion. Storage followed the wasted-power signal: China added 66.4 GW in 2025, roughly 52% more than a year earlier.
The Implicator has argued before that the AI race runs through electrons as much as chips. The next evidence will come from curtailment data, storage additions and data-center interconnection requests in the western hubs.
Frequently Asked Questions
What did the Nature study map?
The study mapped 319,972 solar photovoltaic facilities and 91,609 wind turbines in China’s 2022 asset base using sub-metre satellite imagery and deep learning.
What does the 99.88 TWh figure mean?
It is a modeled gain in effective renewable penetration under nationwide inter-provincial coordination in an 80% dispatchable-flexibility system. It is not a newly built power source.
Why does solar-wind complementarity matter?
Solar output and wind output often peak at different times and places. Pairing regions more widely can smooth generation and reduce the amount of clean power wasted.
How does AI data-center demand fit into this?
China’s data-center capacity is projected to grow sharply by 2030. Some new hubs are being steered toward western regions with stronger renewable resources.
Does the study say China needs fewer power plants?
No. It says coordination can make existing solar and wind assets more useful in the modeled scenario. Real deployment still depends on grid rules, transmission, storage and dispatch.
AI-generated summary, reviewed by an editor. More on our AI guidelines.

Marcus Schuler
Editor-in-Chief and founder of Implicator.ai. Former ARD correspondent and senior broadcast journalist with 10+ years covering tech. Writes daily briefings on policy and market developments. Based in San Francisco. E-mail: editor@implicator.ai